Quick Summary:
Are you a beginner trying to find your footing in the software development industry? Or do you need to be better-versed in how Java debugs the application? If so, you’re at the right place! Debugging Java applications involves identifying and resolving the errors & bugs found in the code. By leveraging various tools and techniques, developers can analyze variable values to ensure the correctness & reliability of their Java applications.
In the software development lifecycle, debugging is a fundamental and essential step. Developers can use it to find and fix bugs, problems, and any unexpected behavior in the code. The accuracy, efficiency, and readability of Java applications are significantly influenced by debugging. By using different debugging tools and approaches
Many advantages come from debugging Java applications. It allows programmers to move through their code, look at variable values, judge expressions, and look at error messages and stack traces.
Developers may quickly browse and comprehend the complexities of their code during runtime with the aid of a debugger offered by contemporary Integrated Development Environments (IDEs) like Eclipse, IntelliJ IDEA, or NetBeans. Doing so makes it easier to spot logical errors, problems with calculations, and deal with unexpected behaviors.
Developers can greatly improve their productivity and program quality by mastering the art of debugging. This article will examine several methods and recommended procedures for efficiently debugging Java programs. Whether you are a novice or an expert developer, the information and abilities you acquire from this manual will enable you to handle complicated problems and create solid and dependable Java applications. This blog will show how to debug Java applications in Eclipse and IntelliJ IDEA. Let’s begin with Eclipse, and we will move forward in the order with all three of the popular options.
Debugging Java Applications with Popular IDE’s
A program’s source code can have problems, which must be found and fixed during debugging. Contemporary IDEs like Eclipse offer debugging tools, which make it simpler for programmers to interactively go through their code and analyze it for errors so they may find and fix them.
Debugging Java Applications with Eclipse
A program can be launched in Debug mode in Eclipse, which makes it easier to step through every line of code. A Debug Perspective, a collection of views offered by Eclipse, is another tool that makes debugging incredibly efficient by allowing code inspection.

Here is a basic program that will be used to demonstrate how to debug a Java application using Eclipse:
public class DebuggingExample{
	public int add(int x, int y){
		int sum = x + y;
		return sum;
	}

	public static void main(String[] args)
	{
		DebuggingExample de = new DebuggingExample();
		int x = 5;
		int y = 8;
		int sum = de.add(x, y);
		System.out.printf("%d + %d = %d",x,y,sum);

	}
}
The code example above defines two straightforward functions, main() and add(). Two numbers, a and b, are added, and their sum is returned by the add() method, which is invoked by the main() method. The following actions are necessary to debug this program:
Step One: Set Breakpoints
A breakpoint is a point in code where the program execution pauses during debugging. This allows the programmer to inspect code and the follow o execution at the defined breakpoint.
To define a breakpoint, either double-click on the left margin in the editor or right-click and select Toggle Breakpoint:


Step Two: Start the program in Debug Mode
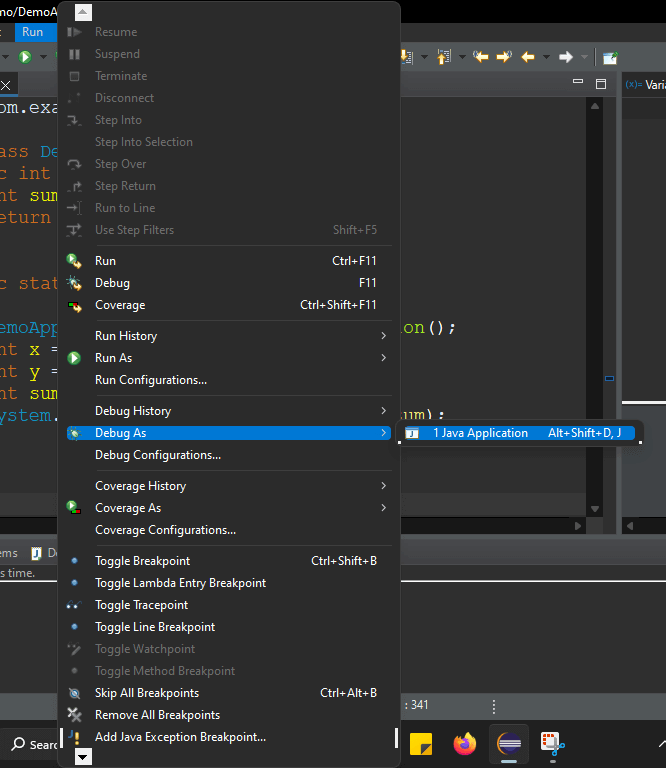
To debug the application, either right-click on the file in Package Explorer or within the Java editor and select Debug As -> Java Application. Or you can click on the bug symbol.
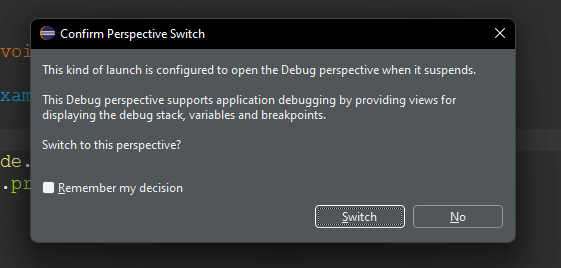
The following viewpoint, which opens when you click Switch in Eclipse, includes a selection of views that are useful for debugging:
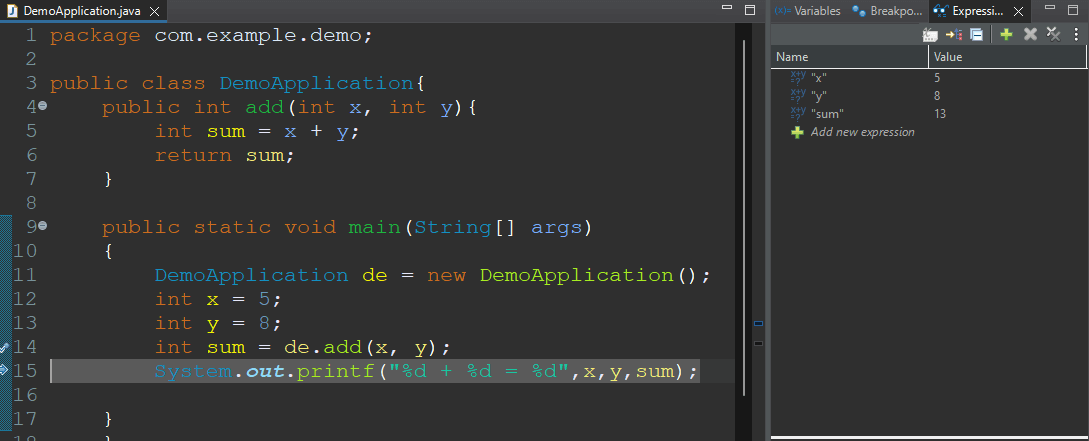
Debug
Displays the call stack, which helps in determining the flow of execution of the program until the breakpoint is reached.
Variable
Displays fields and defined variables in the current stack
Breakpoints
Shows a list of breakpoints in the code and enabling/disabling breakpoints
Expression
Allows defining custom Java expressions to inspect their values
Eclipse also provides several buttons in the toolbar for controlling the flow of execution of the program:
The button shown in the image is the resume button, suspend, terminate, disconnect, step into, step over, and last but not the list step return. These are some of the commonly used buttons, following are the keyboard shortcuts corresponding to these buttons.
| Features | Shortcut | Description |
| Resume | F8 | Used to resume the program execution until the next breakpoint. |
| Step Into | F5 | Executes the current line of code & moves to the next line of the code. However, if the current line calls a method, the debugger steps into the method to execute it. |
| Step Over | F6 | Executes the current line of code & moves to the next line without stepping into any methods or associated functions of the current line. |
| Step Back | F7 | Returns to the method’s caller after stepping back inside the active method. |
Step Three: Add Variable To Expression
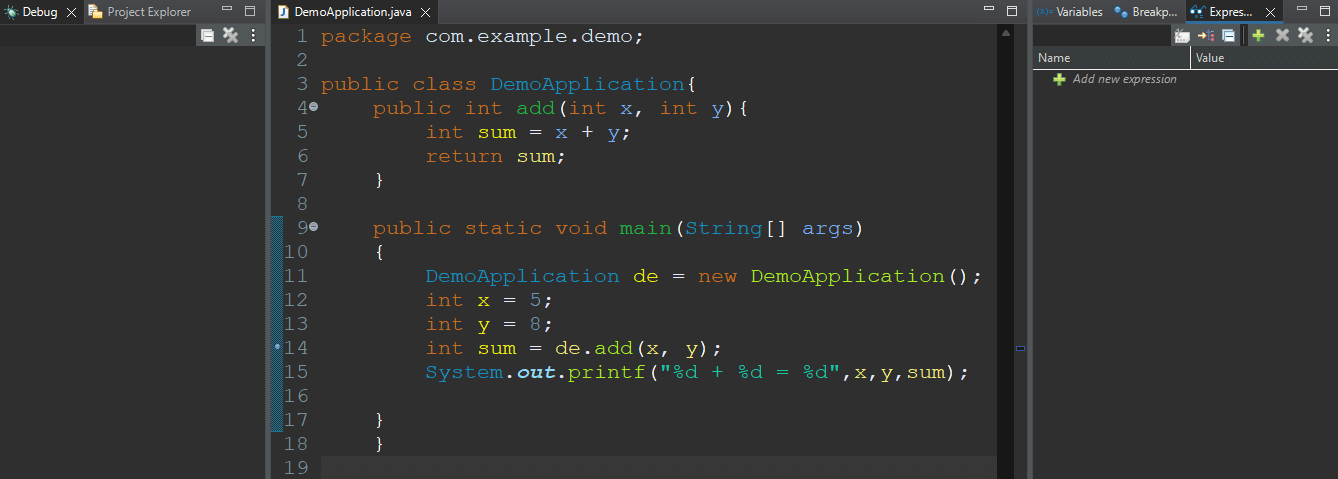
The Expressions view lets you view the contents of any unique Java expressions (including variables) and their values. By selecting Watch from the context menu when right-clicking each of the x, y, and sum variables, for instance, they may be added to the Expressions view to keep track of their values.
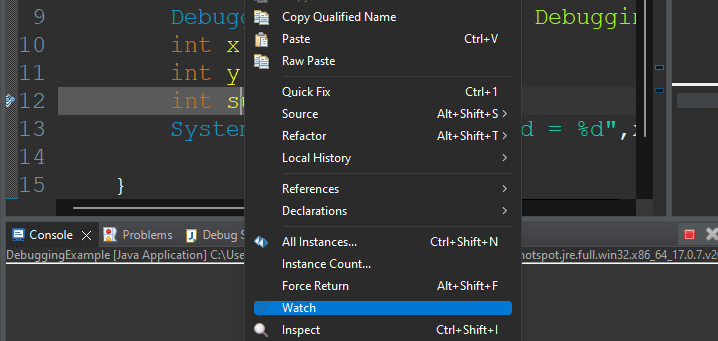
Once this step is done you can check if the variables are added into the expression by clicking on the expression view.
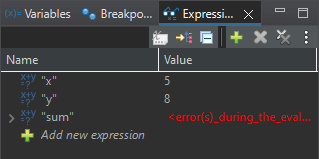
In the expression view the variables x, and y display their correct values. However, as the sum variable hasn’t been declared yet it shows an error in the value column. Once the current line of code will be executed it will display the correct value.
Also Read: – Top Java Development Tools to utilize
Step Four: Step into the Function
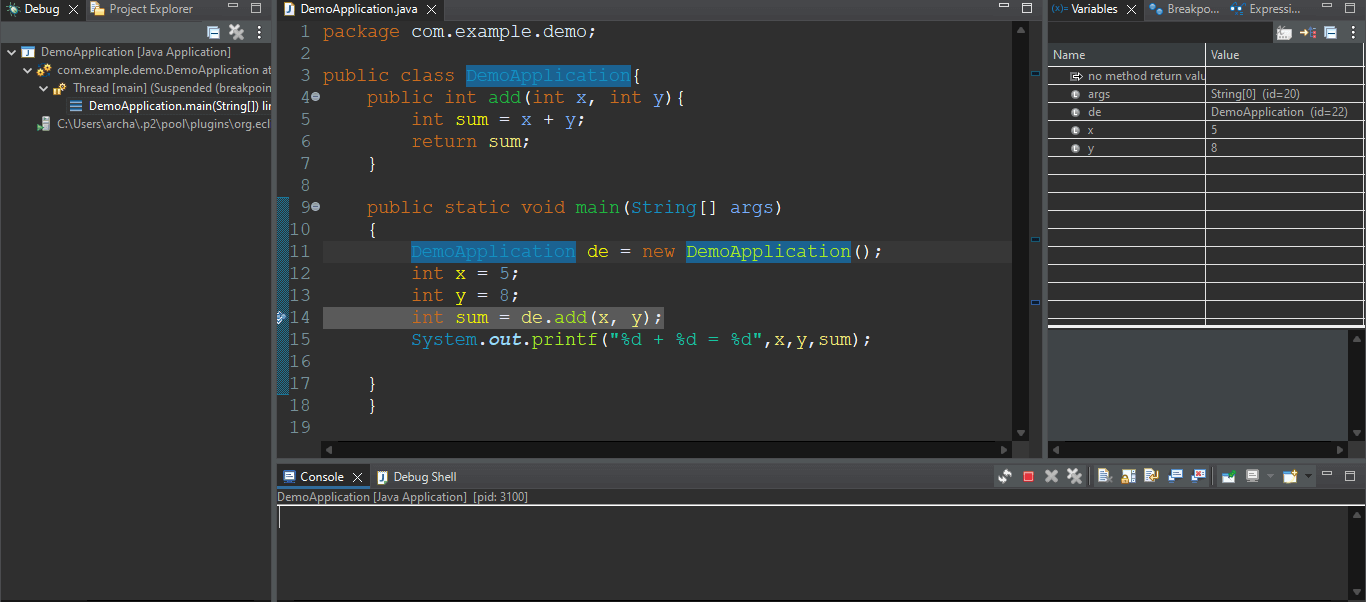
Press F5 for Step into an icon to enter into the add method.
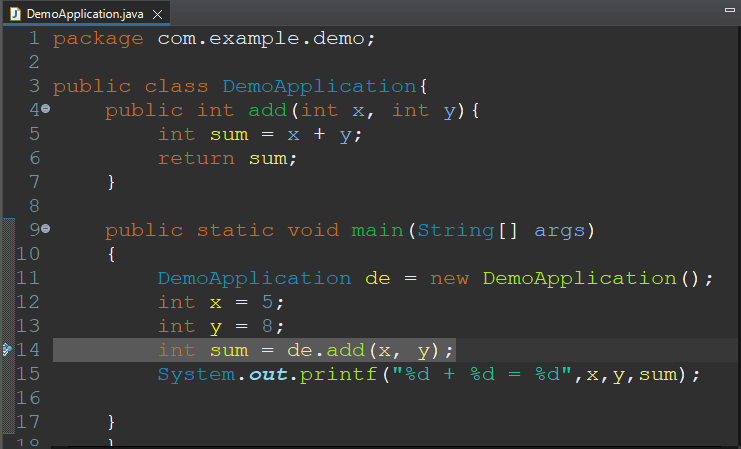
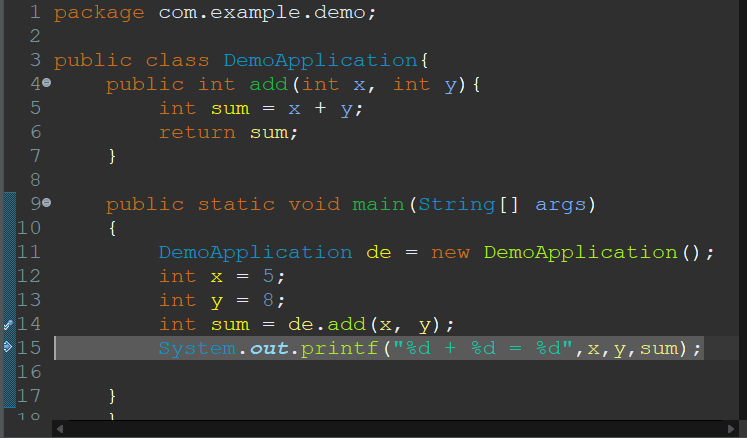
Now if you look at the sum variable in the expression tab you can see that there is an expected result.
Now return to the main() method by pressing Step Over again.
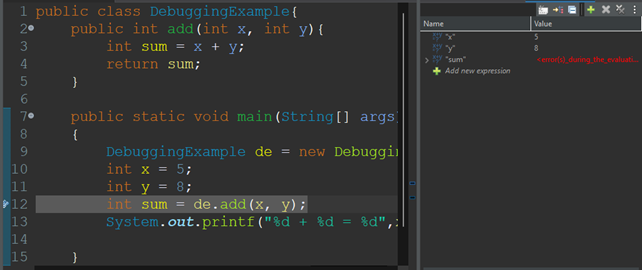
The debugger returns to stop on the same line where it was left previously. Press Step Over again to check the return value from the add() method.
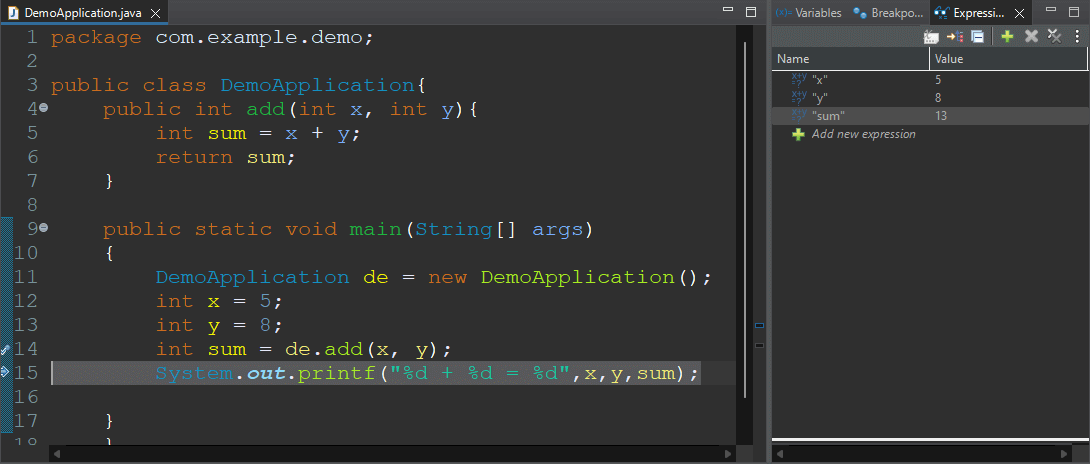
As anticipated, the result variable accurately evaluates the value returned by the add() method, as can be seen in the example.
Step Five: Set Debug Filter
At this point, if you press F5 it will dive into the Java. lang.Integer Class:
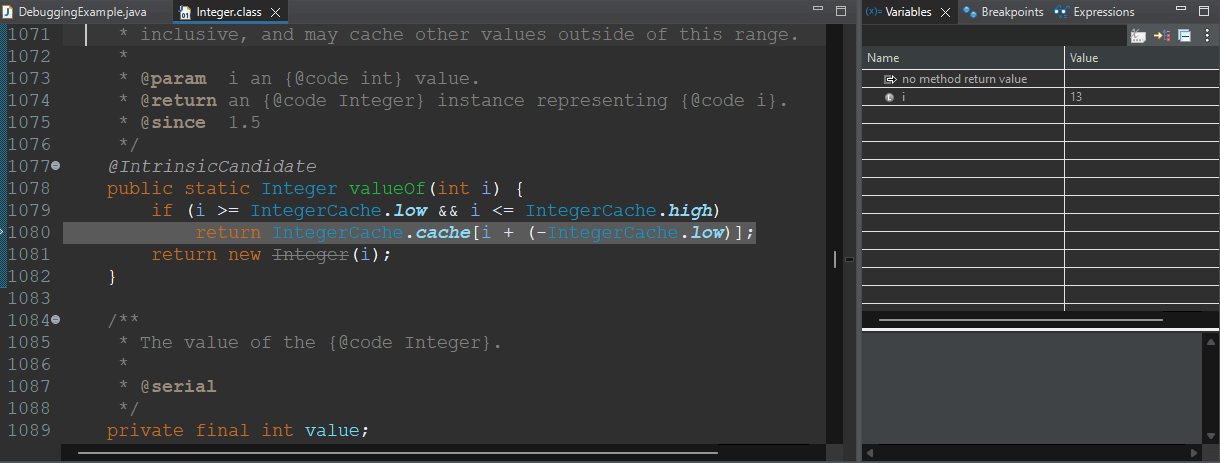
So what’s the reason that it goes into the integer class? Because line 12 in the DebuggingExample class is trying to print an integer value it calls on to the ValueOf method in the integer class and the debugger dives there.
You can easily avoid this by creating the Step Filter. If you’re not sure how to create the Step Filter, follow the steps below.
- Select Edit Step Filters from the context menu when you right-click any item in the pane containing the daemon thread in the Debug view:
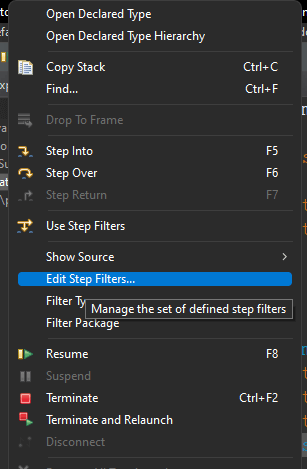
- Use Step Filters should be checked in the pop-up window. As soon as you’ve selected the packages you want to exclude from the filter, click Apply and Close.
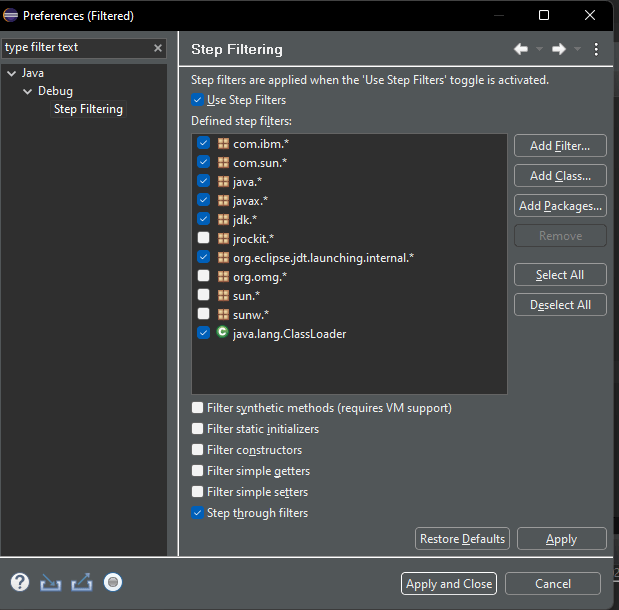
Integer.class code:
Step Six: Print the Result
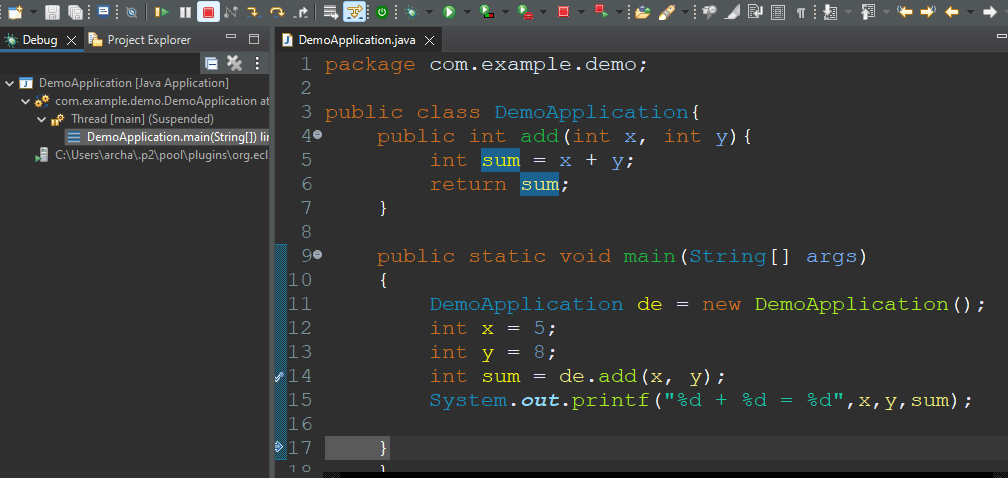
At this point, you can execute & print the result to the Console successfully:

Step Seven: Terminate the Application
By selecting the Terminate icon from the toolbar, you may now end the debugger:
Are you looking to hire java developer?
Get the top-notch web & app solutions from the certified java developers at Aglowid
Debugging Java Applications with IntelliJ IDEA
Now that we have seen how to debug in Java, let’s take a look at how you can debug your Java application using IntelliJ IDEA.

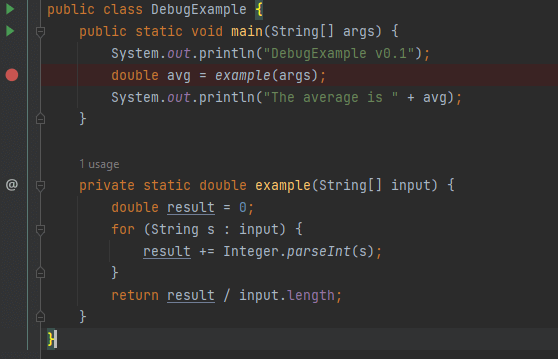
Let’s try debugging a simple application. Following is the example that we would be using in IntelliJ IDEA.
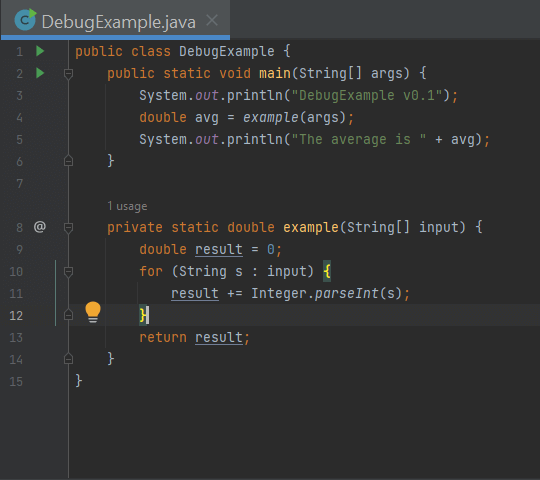
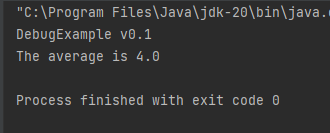
This simple application should average out all of the values supplied as command-line arguments. The result is different from what one would anticipate, but it builds and runs smoothly. Consider the potential location of the suspected error first.
The sampling technique is probably where the unexpected mistake came from. Let’s examine the application’s runtime debugging to identify the error and its cause. Let’s observe it in action.
Step One: Set Breakpoint
It’s crucial to stop the software before the alleged malicious code is run to analyze how it functions in real-time. The breakpoints can be used to accomplish it. The red dot indicates breakpoints.
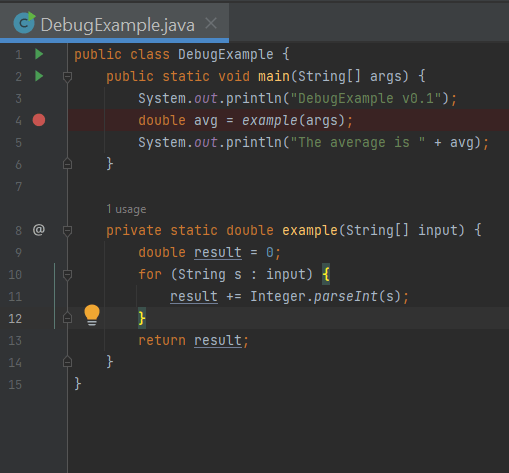
The program will be interrupted here for evaluation, as shown by the red dot. Where the sampling method is invoked, we have set a breakpoint here.
Step Two: Debug the program
Once it is done. Start the program in the debug mode.
Ensure that the run/debug configuration includes these arguments because we will pass them while running and debugging the application. Follow the process below
Right-click on the run icon, and select modify the run configuration.
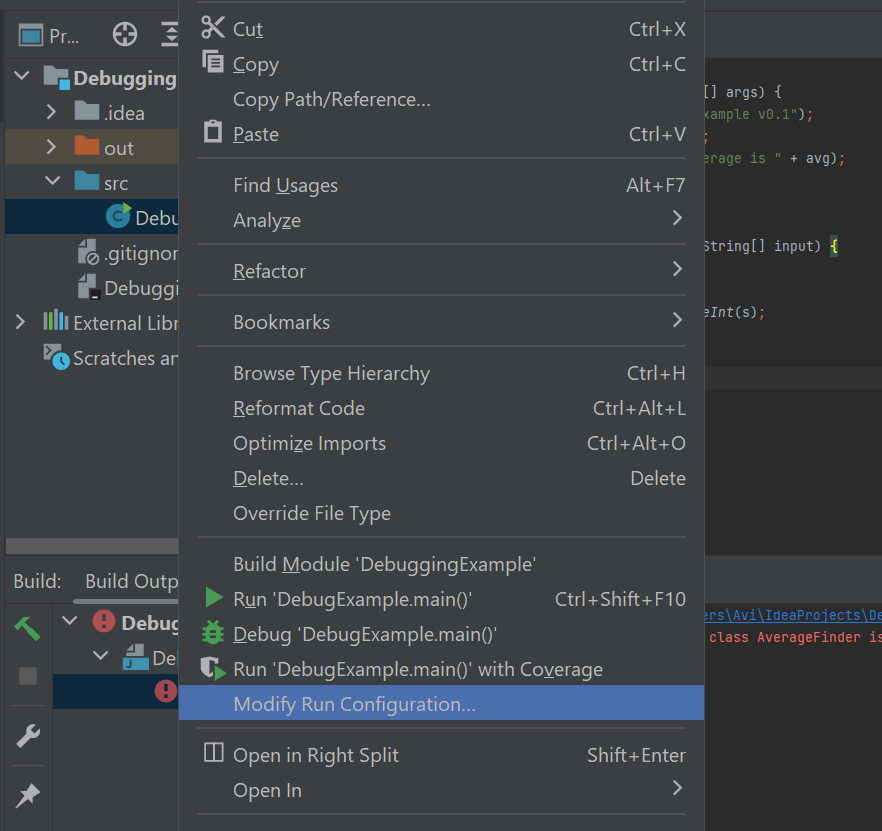
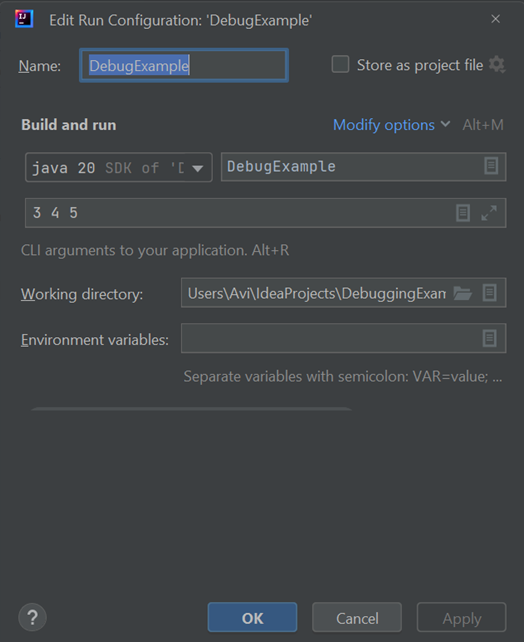
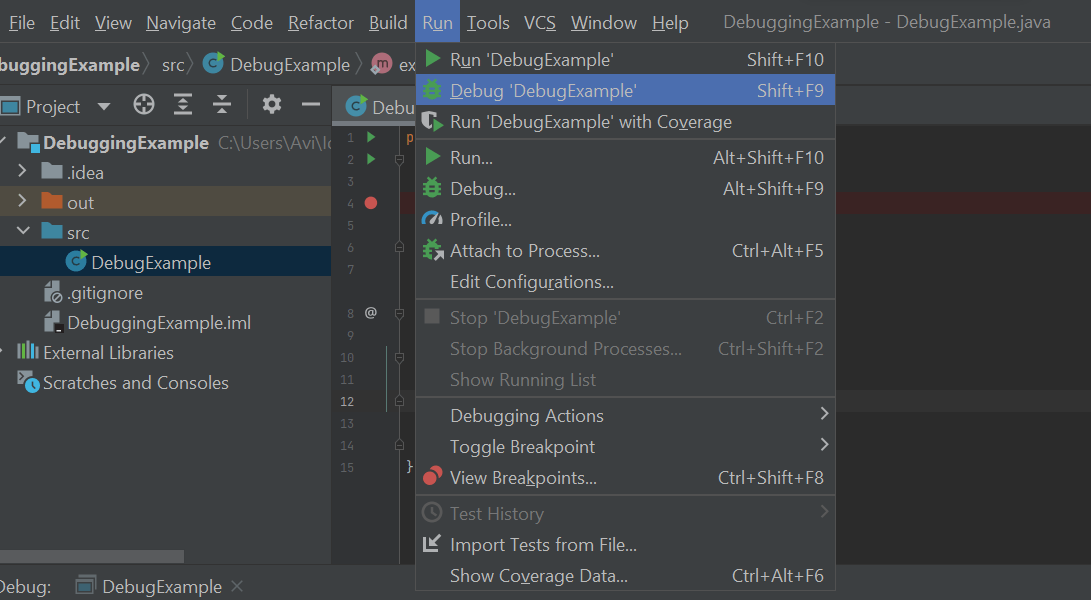
Step Three: Analyze the program
Until a breakpoint is reached, the program continues operating normally after the debugger session has begun. When this occurs, the Debug tool window opens and the line where the application paused is highlighted.
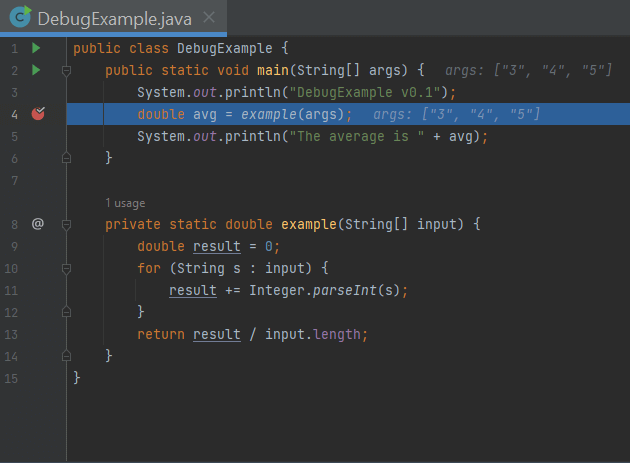
The bolded line has not yet been carried out. The application is now awaiting your additional commands. You can check program state-holding variables while the program is in the suspended state.
Because the example method has not yet been invoked, none of its local variables, such as results, have yet been included in the scoop. Although it is within the main method’s scope, we can check the args contents. In places where args is used, its contents are shown inline:

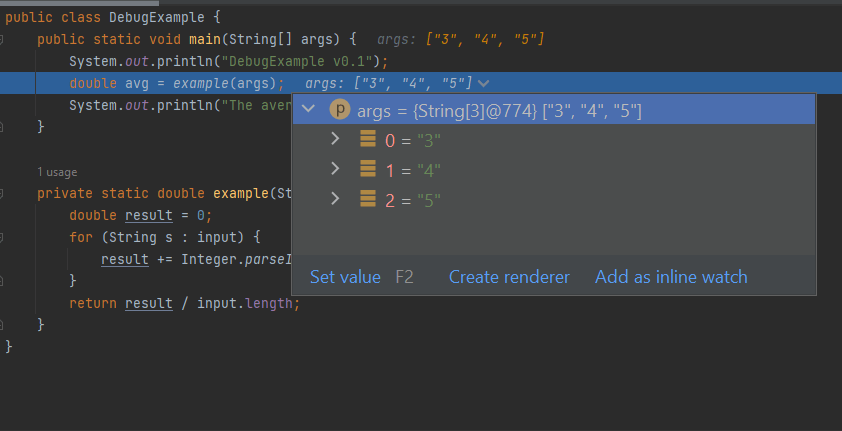
Step Four: Step Into The Program
It’s time to enter the example method and investigate what is occurring there now that we are familiar with the Debug tool window. Follow the step-by-step process below.
Press F7 or the Step Into button to enter the method.

Using the Step Over button or pressing F8 will help you to move one step forward. Take note of the distinction between it and Step Into. The execution is also moved one step forward, but other functions, such as Integer.parseInt(), are not visited.
Also Read: – Top Java Framworks to use
Let’s take another step and see the declaration and modification of the local variable result while the loop iterates.
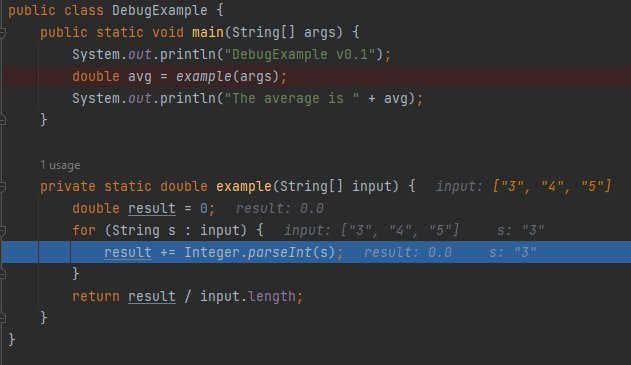
Currently, the value “3” is present in the variable s. It will be transformed into an int and added to the result, which presently has a value of 3.0. So far, no mistakes have been made. The total has been computed accurately.
We need to go two more steps to reach the return statement, where we can notice the omission. Without reducing the result by the number of inputs, we are returning the result, which has the value of .0. The wrong program output was brought about by this.
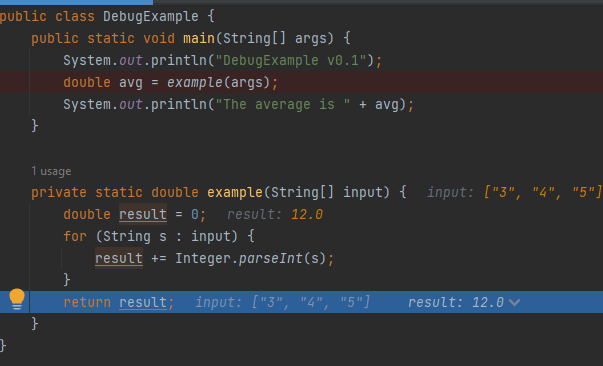
return result/input.length;
Step Five: Stop the Application
Terminate the program using the terminate button

Step Six: Print the Result
Select Run from the menu using the Run button.
Wrapping Up!
In conclusion, the ability to effectively identify and fix code problems through the use of debugging tools is a crucial talent for any developer. Integrated development environments (IDEs), like Eclipse and IntelliJ IDEA, offer specialized tools for use in this process. In this blog, we have used both of these IDEs to demonstrate how you can debug Java applications. Using these IDEs developers can streamline their debugging workflow and greatly increase the effectiveness of the debugging process by taking advantage of the debugging functionality provided by these IDEs.
have a unique app Idea?
Hire Certified Developers To Build Robust Feature, Rich App And Websites


 Say
Say